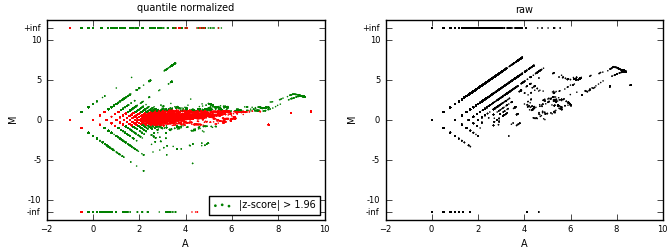
MA plots are used for differential analysis of condition 1 (cond1) vs. condition 2 (cond2).
Data (bedGraphs) from two conditions are quantile-normalized first, then put into a MA-plot.
A sliding window of 10% of A axis span is used to calculate z-scores (of M).
Positive z-score indicates over-representation of counts in condition 1.
Negative z-score indicates over-representation of counts in condition 2.
Because bedGraph format uses the sign to indicate strand, results are split into two bedGraphs. Magnitude equals to the absolute value of z-score and sign indicates strand:
A third bedGraph is also produced showing only windows centered at peaks of high-density smoothed absolute z-values.
M=log(count_cond1/count_cond2), A=log(count_cond1)+log(count_cond2).
Click on region to automatically upload the two bedGraphs with z-scores of differential analysis and start exploring in UCSC browser.
| smoothed_abs_z_score | z_score | A | M | normalized count in condition 1 | normalized count in condition 2 | region | gene_name | sense relative to window | seg_type | seg_biotype |
|---|---|---|---|---|---|---|---|---|---|---|
| 98.75 | 13.69 | 3.55 | 7.10 | 137.5 | 1 | chr1-:204194386..204195086 | PLEKHA6 | same | intron | protein_coding |
| 55.03 | 13.00 | 3.41 | 6.81 | 112.5 | 1 | chr10+:43589940..43590640 | RET | same | intron | protein_coding |
| 40.71 | 1.82 | 9.41 | 1.04 | 973 | 472.5 | chr1+:109642572..109643272 | snoU2-25 | same | ncRNA | snoRNA |
| 37.79 | 2.94 | 5.35 | 1.60 | 71 | 23.5 | chrX-:73047366..73048066 | XIST | same | ncRNA | processed_transcript |
| 31.46 | 3.70 | 5.07 | 1.96 | 66 | 17 | chr7-:100805600..100806300 | VGF | same | 3UTR | protein_coding |
| 31.02 | -10.07 | 1.26 | -4.52 | 0.5 | 11.5 | chr14+:101312607..101313307 | MEG3 | same | ncRNA | processed_transcript |
| 30.14 | -7.81 | 3.62 | -3.62 | 3.5 | 43 | chr10-:116193698..116194398 | ABLIM1 | same | 3UTR | protein_coding |
| 27.68 | 10.94 | 2.44 | 4.88 | 29.5 | 1 | chr1-:204193550..204194250 | PLEKHA6 | same | intron | protein_coding |
| 27.35 | 2.11 | 5.07 | 1.21 | 51 | 0 | chr1-:204194796..204195496 | PLEKHA6 | same | intron | protein_coding |
| 27.17 | 2.40 | 5.00 | 1.35 | 51 | 20 | chrX-:73046829..73047529 | XIST | same | intron | processed_transcript |
| 26.71 | 2.69 | 5.06 | 1.49 | 56 | 20 | chr2-:72356609..72357309 | CYP26B1 | same | 3UTR | protein_coding |
| 25.73 | -8.95 | 1.79 | -3.58 | 1 | 12 | chr3+:173545093..173545793 | NLGN1 | same | intron | protein_coding |
| 24.19 | 9.01 | 3.40 | 4.79 | 55.5 | 2 | chr10+:43604036..43604736 | RET | same | intron | protein_coding |
| 22.61 | 2.28 | 4.06 | 1.34 | 26.5 | 10.5 | chr9-:14276979..14277679 | NFIB | same | intron | protein_coding |
| 22.38 | 1.38 | 8.55 | 0.84 | 502 | 279.5 | chr7+:98479058..98479758 | TRRAP | same | intron | protein_coding |
| 22.05 | -1.73 | 7.58 | -0.58 | 156.5 | 234.5 | chr3-:160232566..160233266 | snoU90 | same | ncRNA | snoRNA |
| 22.01 | 8.84 | 1.88 | 3.75 | 13.5 | 1 | chr1+:67007730..67008430 | SGIP1 | same | intron | protein_coding |
| 21.32 | -5.38 | 2.70 | -2.22 | 3 | 14 | chr2+:149880731..149881431 | KIF5C | same | ORF | protein_coding |
| 20.24 | -7.70 | 1.58 | -3.17 | 1 | 9 | chr16+:58546746..58547446 | NDRG4 | same | 3UTR | protein_coding |
| 18.63 | -7.46 | 1.54 | -3.09 | 1 | 8.5 | chr3+:41281136..41281836 | CTNNB1 | same | 3UTR | protein_coding |
| 18.25 | 7.10 | 1.58 | 3.17 | 9 | 1 | chr1+:211474011..211474711 | RCOR3 | same | intron | protein_coding |
| 18.07 | 5.83 | 9.15 | 2.89 | 1543 | 208.5 | chr11+:65271557..65272257 | inter | same | inter | |
| 17.94 | -3.87 | 3.14 | -1.63 | 5 | 15.5 | chr2-:127811348..127812048 | BIN1 | same | intron | protein_coding |
| 17.72 | 2.60 | 3.58 | 1.55 | 20.5 | 7 | chr9-:66456255..66456955 | inter | same | inter | |
| 17.38 | 2.31 | 5.53 | 1.30 | 72.5 | 29.5 | chr15-:37391069..37391769 | MEIS2 | same | 5UTR | protein_coding |
| 17.28 | -8.51 | 1.04 | -4.09 | 0.5 | 8.5 | chr9+:124094610..124095310 | GSN | same | 3UTR | protein_coding |
| 17.25 | -6.66 | 1.40 | -2.81 | 1 | 7 | chr5-:81031639..81032339 | SSBP2 | same | intron | protein_coding |
| 16.94 | -7.11 | 3.20 | -3.22 | 3 | 28 | chr2+:45886852..45887552 | PRKCE | same | intron | protein_coding |
| 16.73 | -7.52 | 0.85 | -3.70 | 0.5 | 6.5 | chr8+:91968838..91969538 | NECAB1 | same | 3UTR | protein_coding |
| 16.46 | 3.27 | 5.19 | 1.75 | 67 | 0 | chr1-:204193927..204194627 | PLEKHA6 | same | intron | protein_coding |
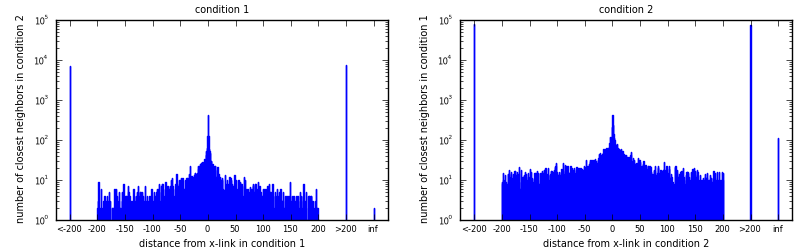
x-links in condition 1: 165524
x-links in condition 2: 17741
All x-link positions (union): 182831
Positions shared by both conditions (intersection): 434
Jaccard index (intersection/union): 0.0024
For each x-link in condition 1 (condition 2), look for nearest x-link in condition 2 (condition 1). Draw histogram of distances to closest neighbors.
Average distances (full span), all include distance 0:
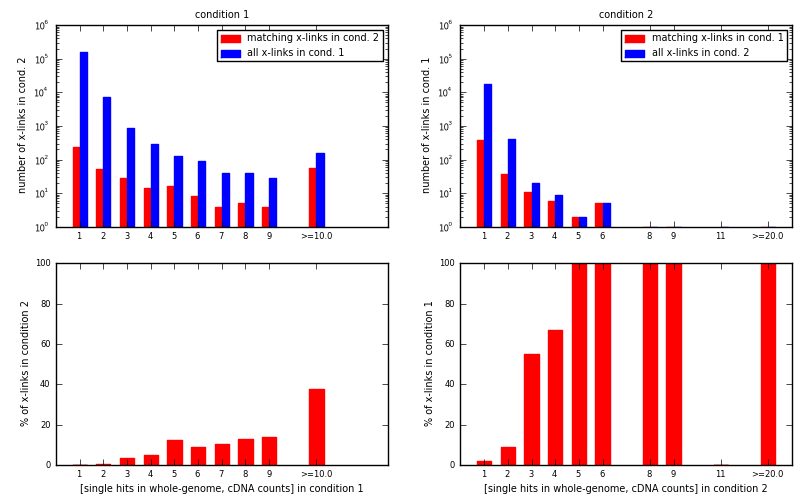
[eps]For each x-link position with specific value stored in input bedGraph for condition 1 (condition 2) look if same position in bedGraph for condition 2 (condition 1) has a non-zero value.
 [eps]
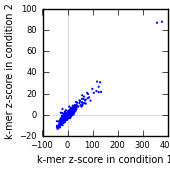
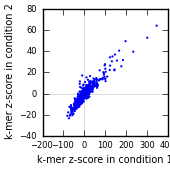
[eps]For k-mer analyses performed with same parameters on both conditions, report on similarity of results.
Similarity is measured by correlation of z-scores of all k-mers, and number of top k-mers shared by both conditions.
| compared | analysis parameters | condition | analysis id |
|---|---|---|---|
| True | intervals=[(-30, -10), (10, 30)], k=5, random_perms=100, valid_region_types=['ncRNA', 'ORF', '3UTR', '5UTR', 'intron'] | condition 1 | 52299 |
| True | intervals=[(-30, -10), (10, 30)], k=5, random_perms=100, valid_region_types=['ncRNA', 'ORF', '3UTR', '5UTR', 'intron'] | condition 2 | 52326 |
| True | intervals=[(-50, 50)], k=5, random_perms=100, valid_region_types=['ncRNA', 'ORF', '3UTR', '5UTR', 'intron'] | condition 1 | 56690 |
| True | intervals=[(-50, 50)], k=5, random_perms=100, valid_region_types=['ncRNA', 'ORF', '3UTR', '5UTR', 'intron'] | condition 2 | 56699 |
| average rank condition 1 & 2 | kmer | rank condition 1 | z-score condition 1 | rank condition 2 | z-score condition 2 |
|---|---|---|---|---|---|
| 2 | GTGTG | 2 | 375.0 | 2 | 87.5 |
| 3 | TGTGT | 3 | 354.9 | 3 | 86.6 |
| 5 | CGTGT | 5 | 129.1 | 5 | 30.5 |
| 6 | ATGTG | 6 | 123.3 | 6 | 26.3 |
| 6 | GTGTA | 8 | 116.9 | 4 | 31.2 |
| 6.5 | TGTGC | 4 | 132.5 | 9 | 21.5 |
| 8.5 | GTATG | 7 | 123.1 | 10 | 21.3 |
| 8.5 | GTGCG | 9 | 114.2 | 8 | 22.3 |
| 9 | TGTAT | 11 | 98.0 | 7 | 24.4 |
| 11 | TGCGT | 10 | 104.0 | 12 | 20.6 |
| 13.5 | GCGTG | 16 | 77.3 | 11 | 20.6 |
| 13.5 | TATGT | 14 | 80.9 | 13 | 19.5 |
| 14.5 | TGTGA | 13 | 85.1 | 16 | 16.4 |
| 16 | TTGTG | 15 | 80.0 | 17 | 15.6 |
| 17.5 | GAATG | 12 | 90.6 | 23 | 13.4 |
| average rank condition 1 & 2 | kmer | rank condition 1 | z-score condition 1 | rank condition 2 | z-score condition 2 |
|---|---|---|---|---|---|
| 2 | GTGTG | 2 | 344.4 | 2 | 63.9 |
| 3 | TGTGT | 3 | 299.7 | 3 | 52.5 |
| 4.5 | GTGTA | 5 | 195.9 | 4 | 49.3 |
| 5 | GTATG | 4 | 233.1 | 6 | 39.4 |
| 6.5 | CGTGT | 8 | 165.6 | 5 | 40.4 |
| 8 | ATGTG | 6 | 183.6 | 10 | 31.5 |
| 8.5 | TGCGT | 10 | 145.6 | 7 | 36.7 |
| 10 | TGTAT | 9 | 154.8 | 11 | 31.0 |
| 10.5 | GTGCG | 13 | 133.5 | 8 | 34.9 |
| 11.5 | GAATG | 7 | 175.9 | 16 | 25.6 |
| 12.5 | GTGTT | 16 | 121.7 | 9 | 34.0 |
| 13 | TATGT | 14 | 131.0 | 12 | 30.3 |
| 14.5 | TGTGC | 11 | 144.1 | 18 | 22.5 |
| 15 | TTGTG | 15 | 122.5 | 15 | 26.3 |
| 16 | TGAAT | 12 | 142.0 | 20 | 21.9 |
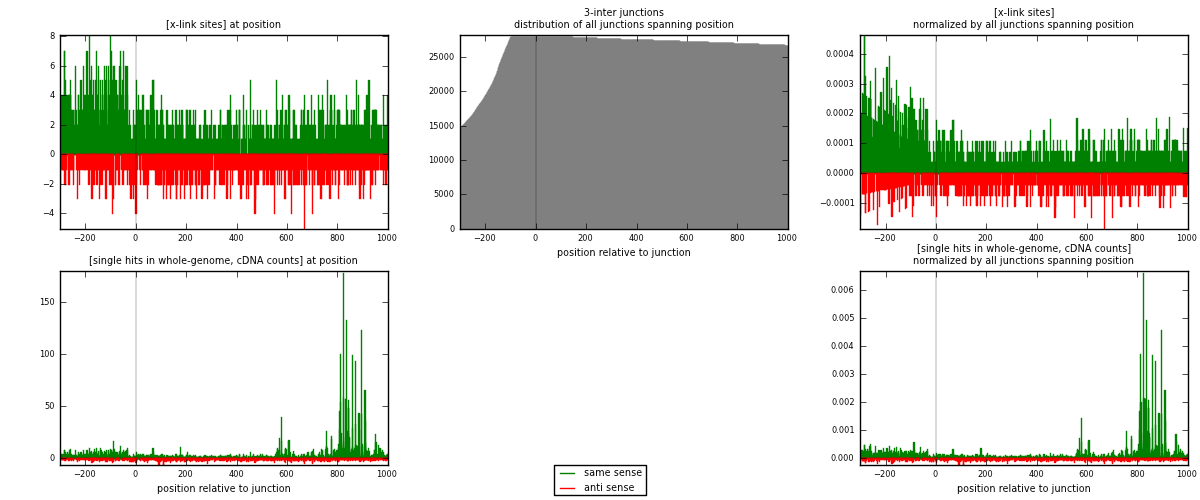
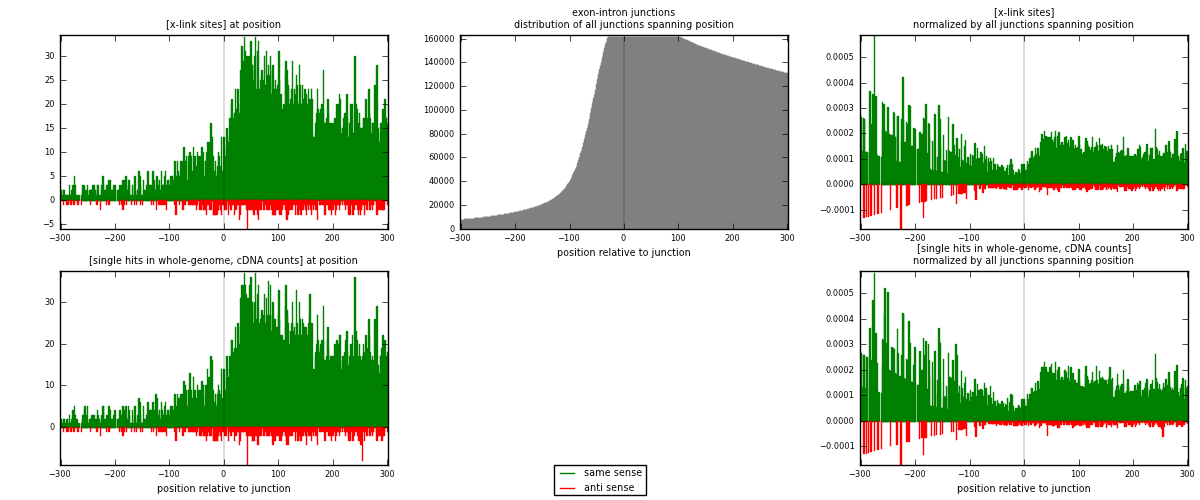
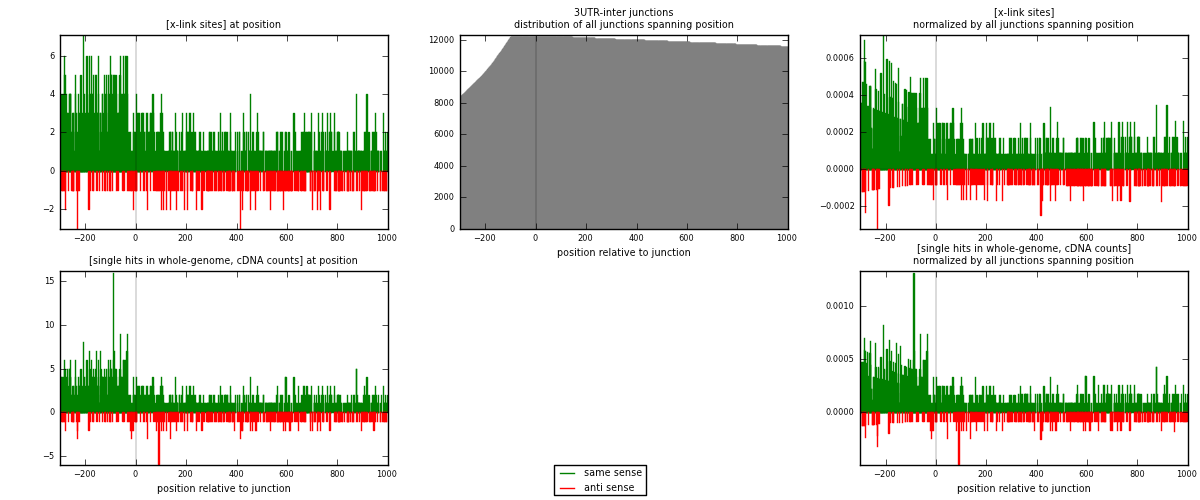
For RNAmap analyses performed with same parameters on both conditions, report on similarity of results.
RNAmaps are compared by normalizing them first to sum 1.0 and then taking the average squared absolute difference (units are squared abs. difference per 1000 positions).
| compared | analysis parameters | condition | analysis id |
|---|---|---|---|
| True | maxD_flanking=1000, maxD_within=300, maxU_flanking=-1000, maxU_within=-300, smoothing=0 | condition 1 | 52300 |
| True | maxD_flanking=1000, maxD_within=300, maxU_flanking=-1000, maxU_within=-300, smoothing=0 | condition 2 | 52327 |
| squared abs difference | RNAmap | variable | map in condition 1 | map in condition 2 |
|---|---|---|---|---|
| 0.0049 | 3-inter | [x-link sites] (same) | link | link |
| 0.0050 | 3-inter | normalized [x-link sites] (same) | link | link |
| 0.0050 | 3-inter | [single hits in whole-genome, cDNA counts] (same) | link | link |
| 0.0052 | 3-inter | normalized [single hits in whole-genome, cDNA counts] (same) | link | link |
| 0.0054 | exon-intron | [x-link sites] (same) | link | link |
| 0.0058 | exon-intron | [single hits in whole-genome, cDNA counts] (same) | link | link |
| 0.0065 | 3UTR-inter | [x-link sites] (same) | link | link |
| 0.0066 | 3UTR-inter | normalized [x-link sites] (same) | link | link |
| 0.0066 | 3UTR-inter | [single hits in whole-genome, cDNA counts] (same) | link | link |
| 0.0067 | 3UTR-inter | normalized [single hits in whole-genome, cDNA counts] (same) | link | link |